" Visualising Plant Development
and Gene Expression in 3D using Optical Projection Tomography”
Karen
Lee, Jerome Avondo, Harris Morrison, Lilian Blot, Margaret Stark, James Sharpe,
Andrew Bangham and Enrico Coen.
John
Innes Centre and
Plant
Cell (in press).
Supplementary Data: QtVolView
The QtVolViewLITE program is designed to run
on any PC with a 64 Mbyte graphic card. It is suitable for viewing the data
shown in Figures 1A and 2A as colour OPT volume and section views of the Antirrhinum
flower. Internal floral structures such as anther lobes and the ovary at the
base of the carpel are revealed. Three OPT scan channels are visible. Transmission (shown in blue), endogenous
fluorescence, Leica TXR filter (shown in red) and GFP fluorescence, GFP1 filter
(shown in green).
The data can be viewed interactively as a
volume from different angles and as virtual sections. The volume can be clipped
to reveal internal structures. See the Quick Start pdf. The full QtVolView
program uses more specialised graphic card features and is available on
request.


Acknowledgements: BBSRC for grant support,
JIC/UEA/MRC and MRC Technology.
Software team: Jerome Avondo with help from
Lilian Blot and the Bangham group in the Computational Biology Group, Computing
Sciences,
Top
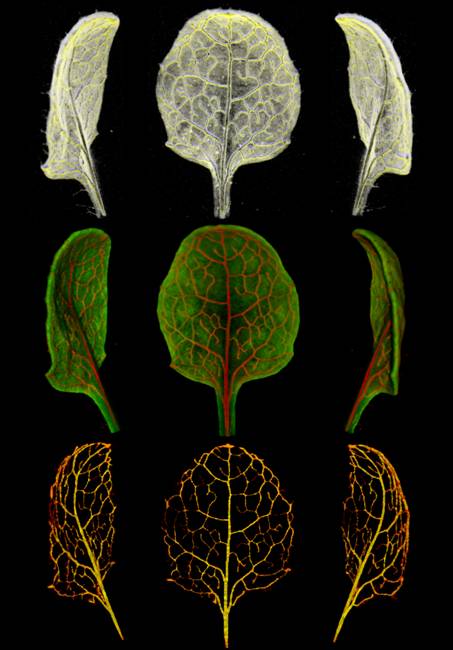
row; volume view of mature ATHB8:GUS Arabidopsis leaf with stained veins (m2, 9
dfs) displayed using QtVolView lighting and tone-shader effects. Middle row;
combined transmission and fluorescent (GFP1) OPT channels. Visible channel is
red, fluorescent channel is green. Bottom row; stained veins extracted using
semi-automatic segmentation tools. In the application the leaf can be viewed
from any angle, re-coloured, etc.