|
BuddhabrotWritten by Paul BourkeNovember 2002 Inspired by the Buddhabrot technique invented by Melinda Green and named by Lori Gardi. Sample source code: buddha.c |
|
|
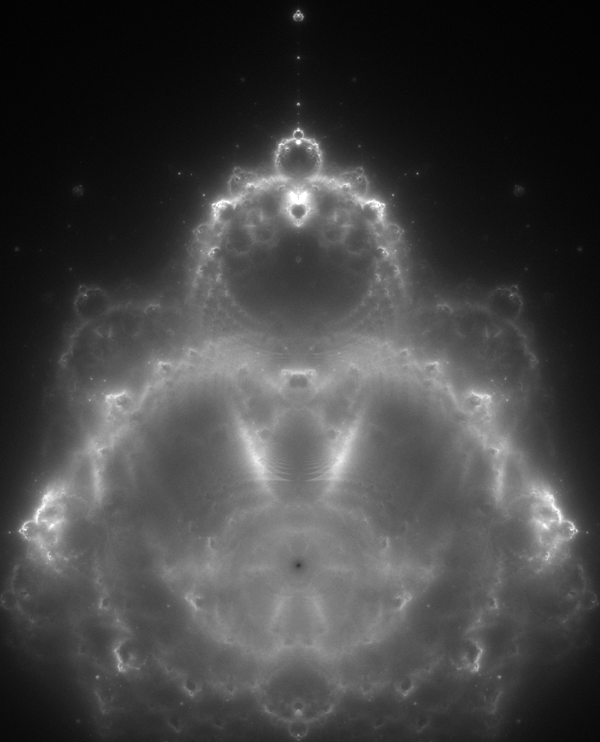
The images on this page are created using the standard iterative series of the Mandlebrot, that is, iterate the function zn+1 = zn2 + z0 where z0 is each point in the image plane (complex plane). However, instead of recording the behavior of the series at each point z0 we now consider only those points that escape to infinity and we create a density plot of the terms in the series. The result then is a 2D density plot of the trajectories that escape to infinity. The following shows the Buddhabrot for that part of the complex plane that is interesting, the boundary of the Mandelbrot is shown in the same coordinate system in red. 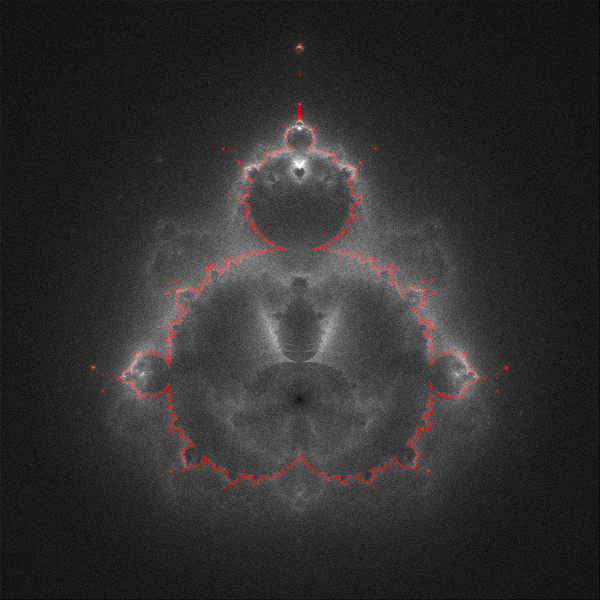 Complex plane: -2 <= real <= 1 and -1.5 <= imaginary <= 1.5
One unfortunate consequence of how these images are created is that zooming in becomes increasingly inefficient. Points on an escape trajectory that pass through an arbitrary small region of the complex plane could have come from distance regions. So when computing the Buddhabrot of a zoomed in portion of the complex plane, one still needs to choose z0 values from the whole plane. This isn't quite true since all points outside the circle of radius 2 escape monotonically, one "only" has to sample points within that circle. But as the region being computed gets smaller the chance of a trajectory passing through it deceases so it takes more iterations before the density plot becomes significant. One might as well compute increasingly high resolution versions of the Buddhabrot, this gives the entire plane to any chosen zoom for the same (approximately) amount of computation. 
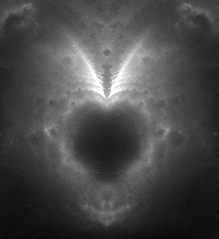
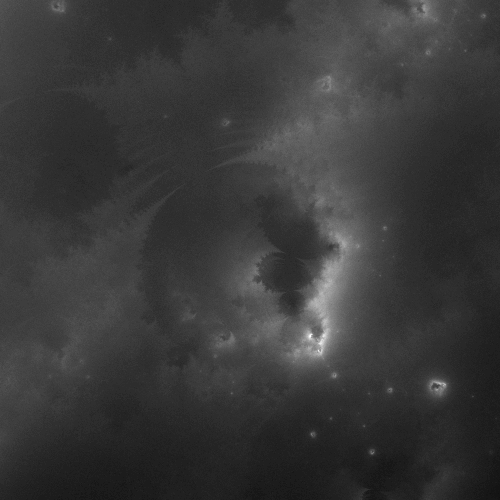
While the normal Mandelbrot is "dull" on the interior, the Buddhabrot has lots of internal structure. The following is close to the center of the large Mandelbrot bulge. 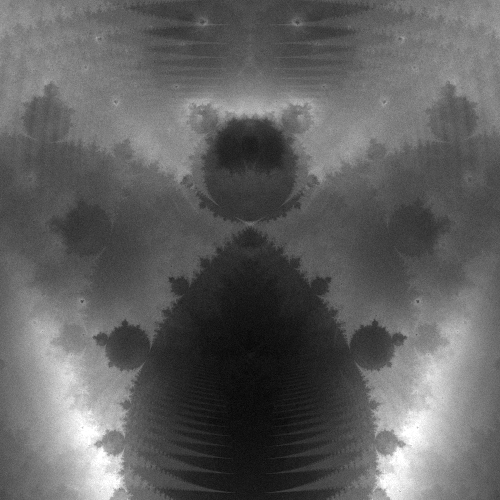
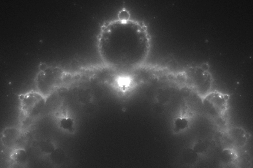
Unlike the Mandelbrot where choosing the number of iterations over which to decide on the behavior of the series doesn't have a profound effect on the actual structure, in the Buddhabrot it can. For example the following two images are of the same region ("the nipple"), the first uses a high number of iterations (2000) while the second uses a smaller number (200). 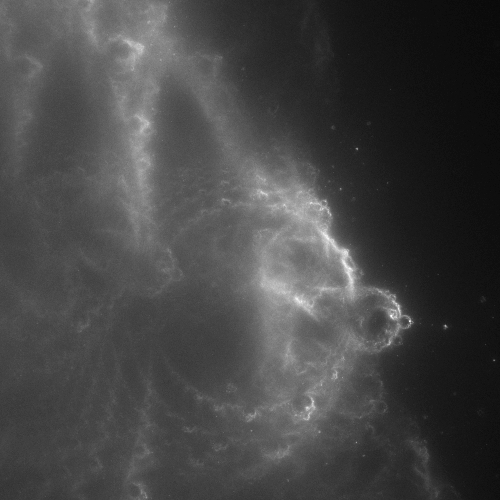 Bail-out: 2000 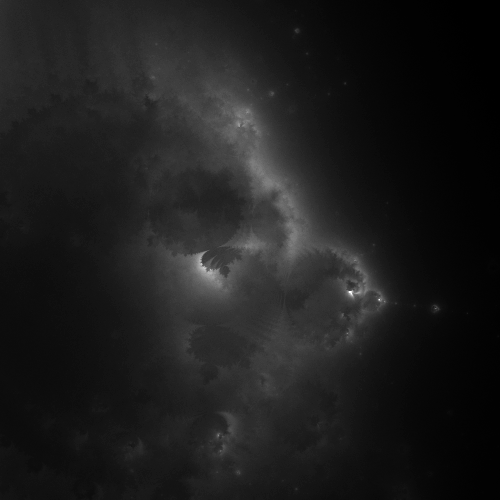 Bail-out: 200
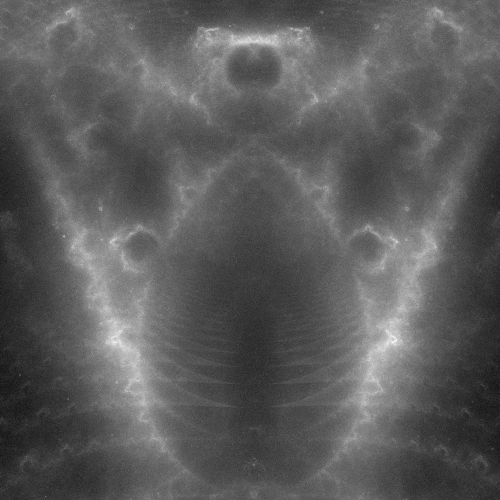
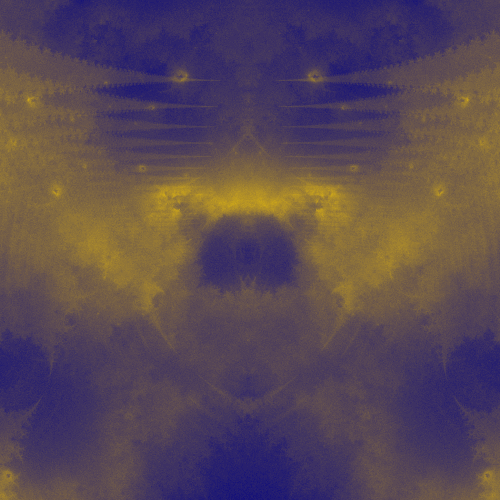
The following coloured version was created by instead of the trajectory adding to the density at each point, the vector (x0, y0) is accumulated. The length of the final vector determines the brightness and the angle the colour. This colour codes the influence of the region the trajectory starts from. 

|